Definition of Flow Cytometry
"Cyto"
- Greek for hollow/cell (‘kytos’)
- Greek for hollow/cell (‘kytos’)
"Metry"
- Greek for the action or process of measuring ("metria")
“Cytometry is a process for measuring the physical and chemical characteristics of biological cells. In flow cytometry the measurements are taken as cells flow through the instrument in a fluid stream.”
Howard Shapiro, Practical Flow Cytometry 4th ed.
A quick note about FACS
F - Fluorescence
A - Activated
C - Cell
S - Sorting
A - Activated
C - Cell
S - Sorting
- More properly known as as flow cytometry
- FACS is a brand name and trademark of BectonDickinson
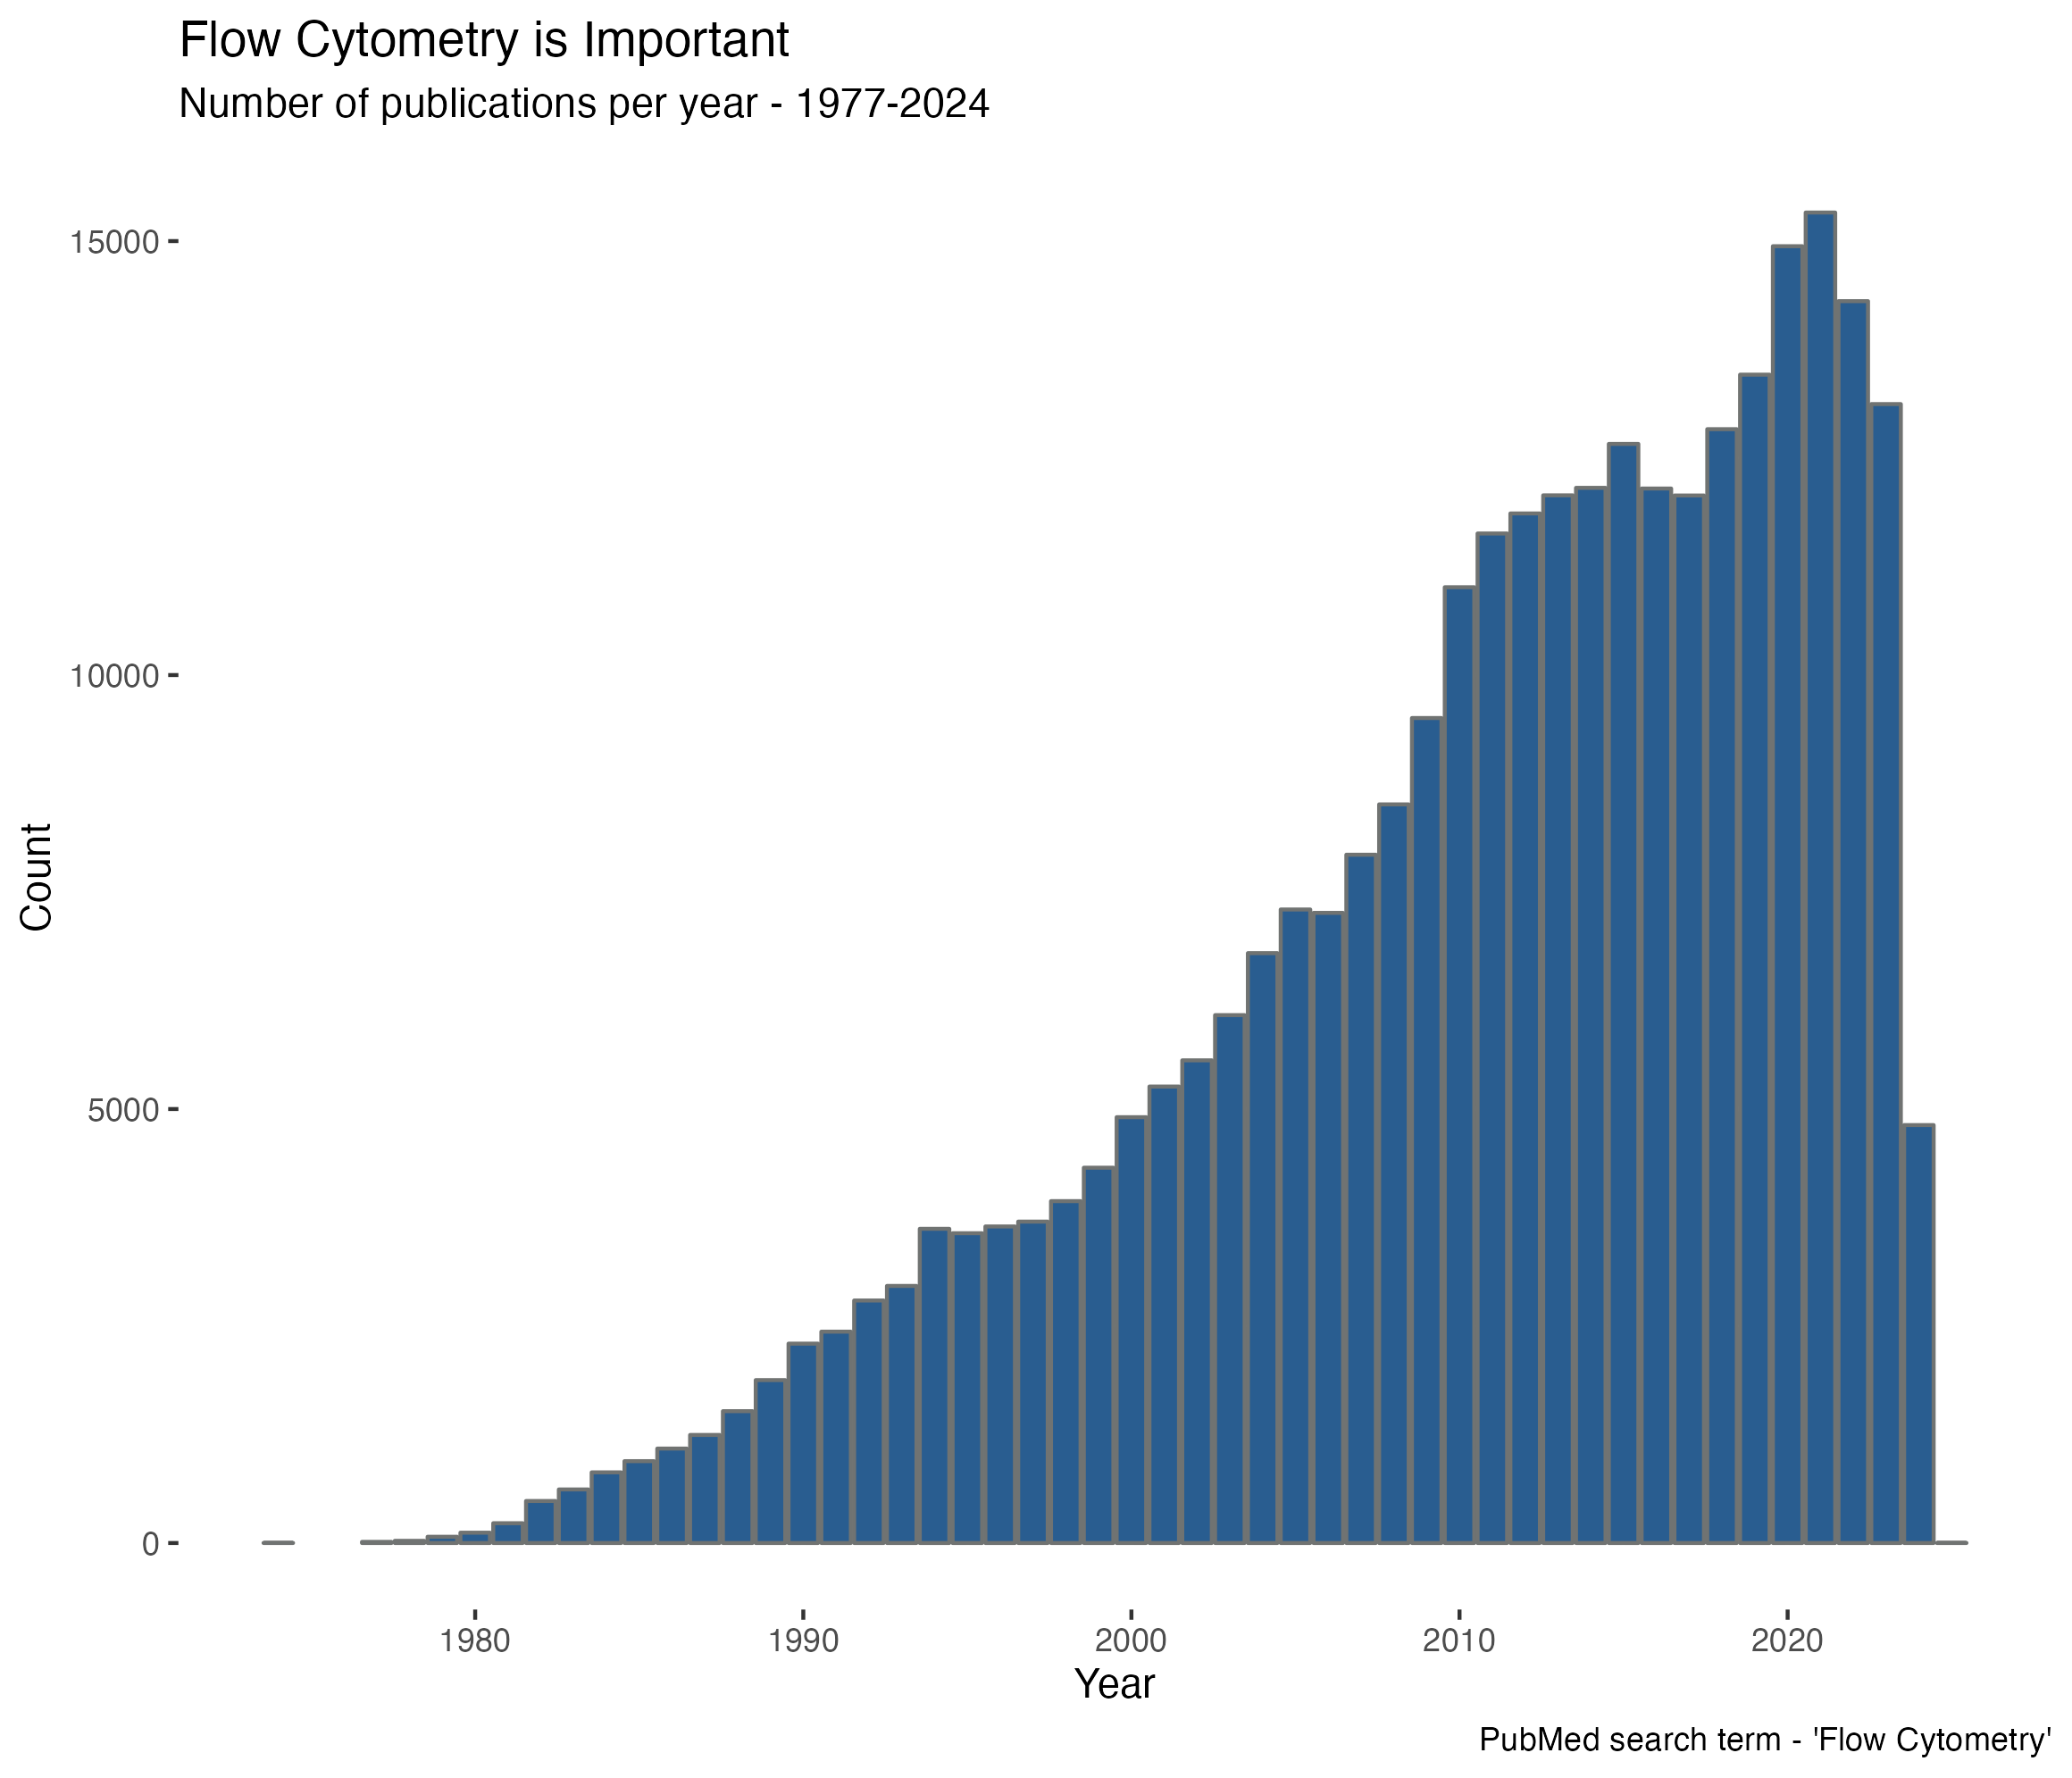
Flow Cytometry is core to numerous studies
- Number of publications on PubMed mentioning "flow cytometry "
Sorters vs. Analysers
Analysers acquire information from cells
Sorters can separate specific populations of cells
Microscopy - Overview
Flow Cytometry - Overview
- Light
- Slide
- Fluorescence
- Filters
- Observation

- Laser
- Fluidics
- Fluorescence
- Filters
- Electronics
- Quantitation

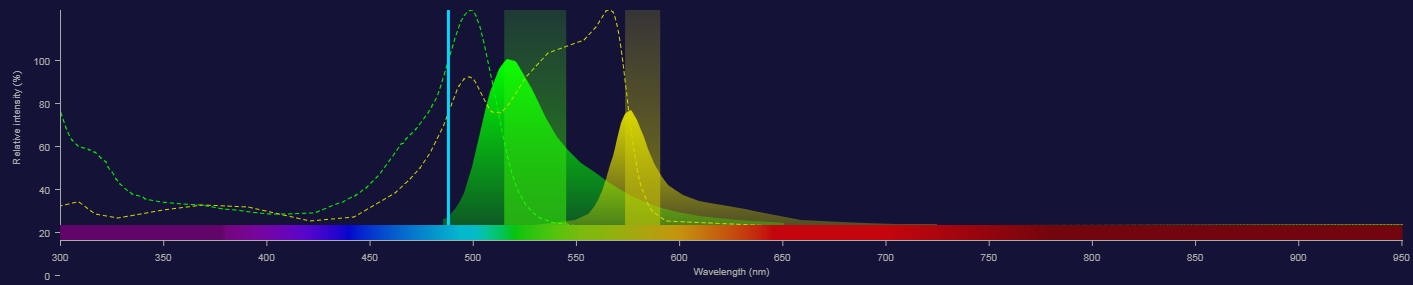
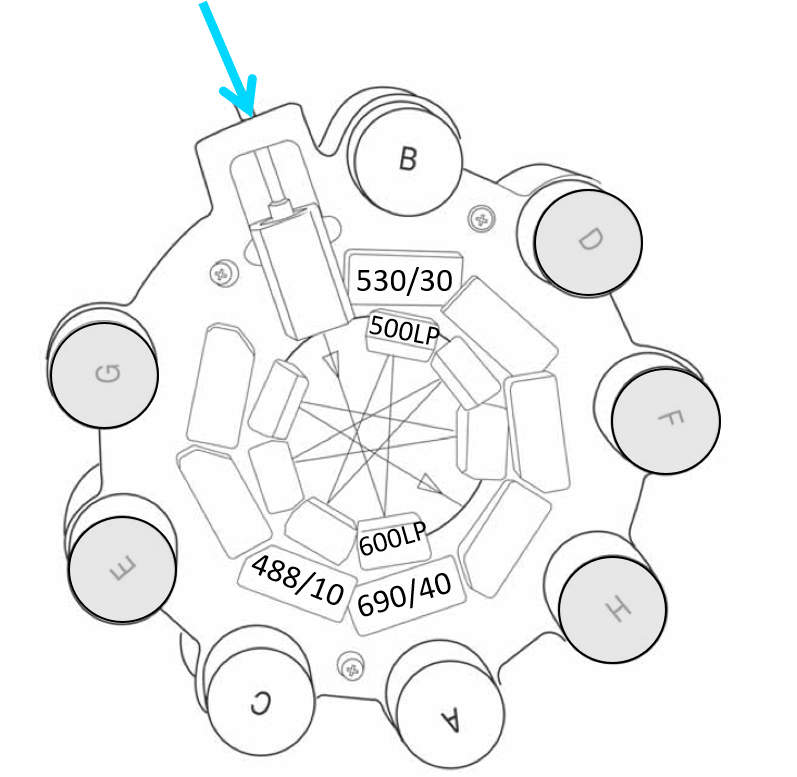
Flow Cytometry - A detector for every "colour"

For each fluorophore we want to visualize we need a separate Photo Multiplier Tube (PMT), filter set and channel to record the data
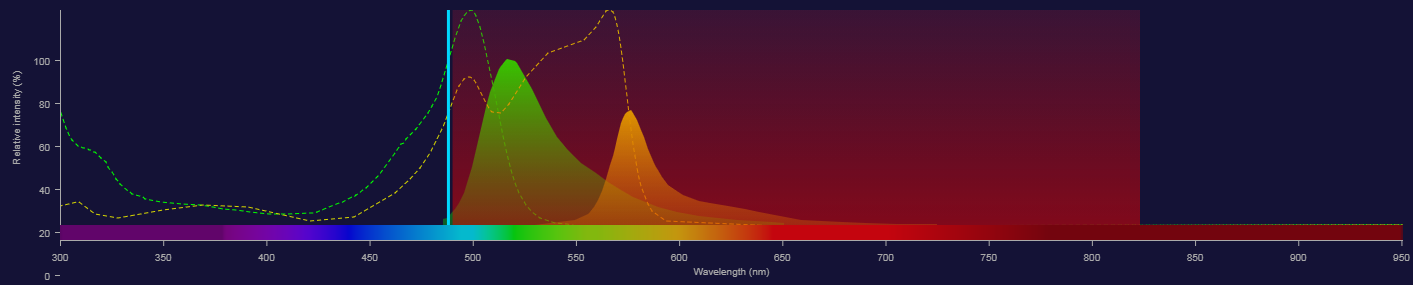
Conventional Flow Cytometry partitions the spectrum
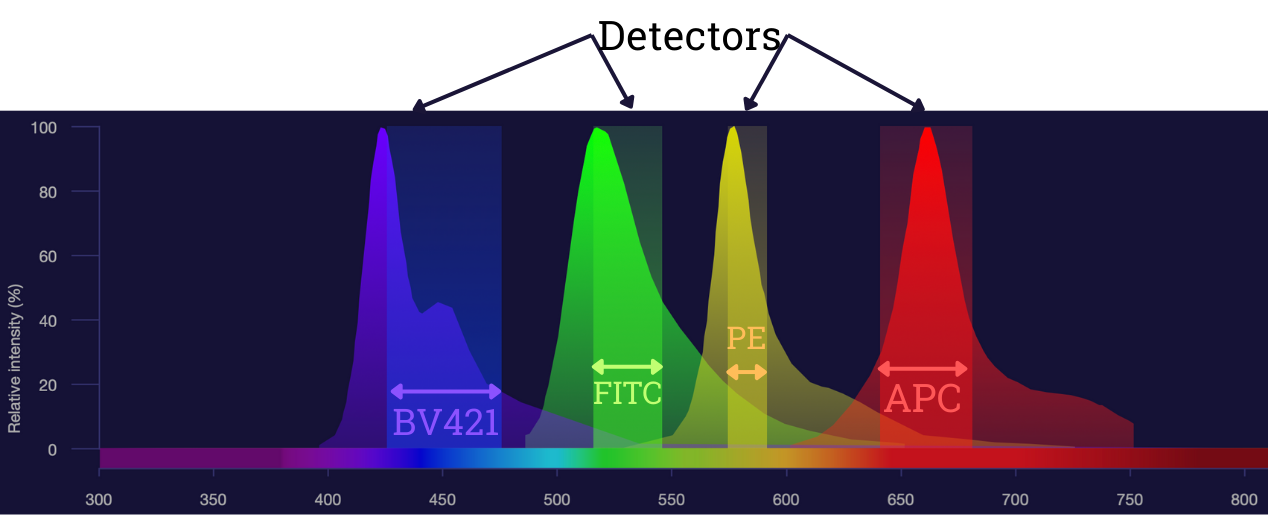
Chop up the spectrum into sections and associate the light from each section with a specific fluorophore
Spectral Flow Cytometry looks at everything
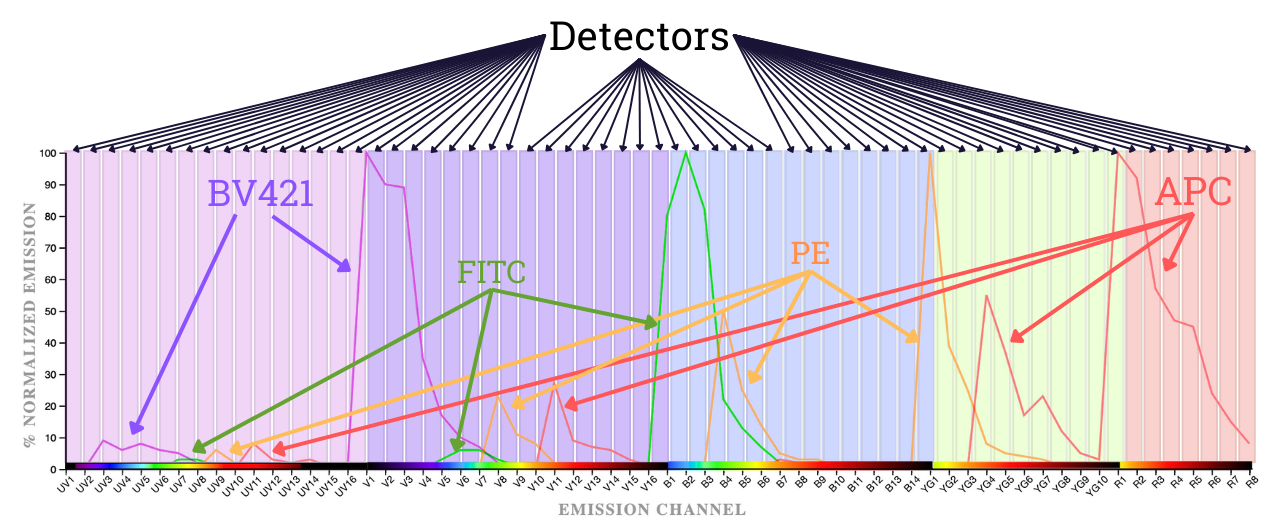
Look at all of the spectrum all of the time. Identify a fluorophore from the unique fingerprint it has across the entire visual spectrum
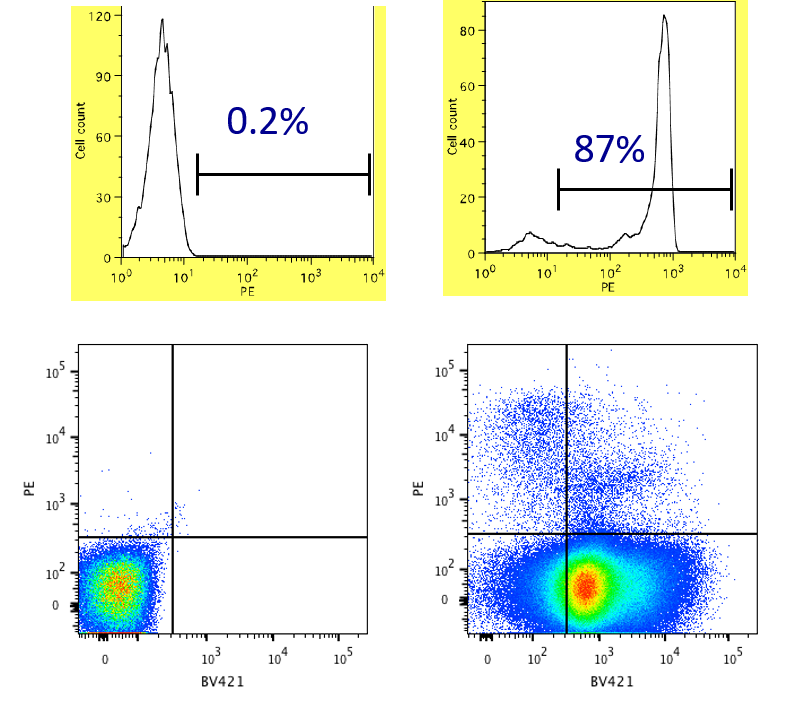
What does flow cytometry data look like?
Flow Cytometry is all about fluorescence
If it's fluorescent we can see it
If we can see it we can sort it!
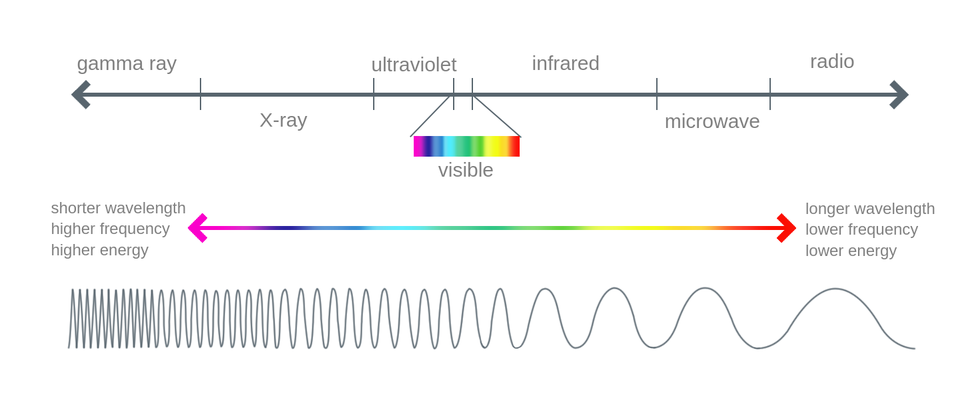
The Electromagnetic Spectrum
1
2
Laser Wavelengths

Fluorescence - Physical Properties

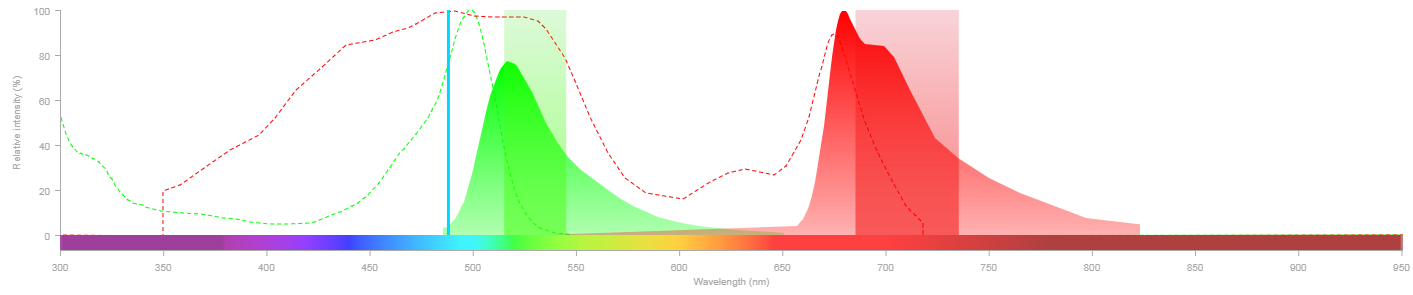
Fluorescent Spectrum
- Absorption vs Emission
- Excited by one wavelength (dotted line)
- Emits at another (higher) wavelength (solid line)
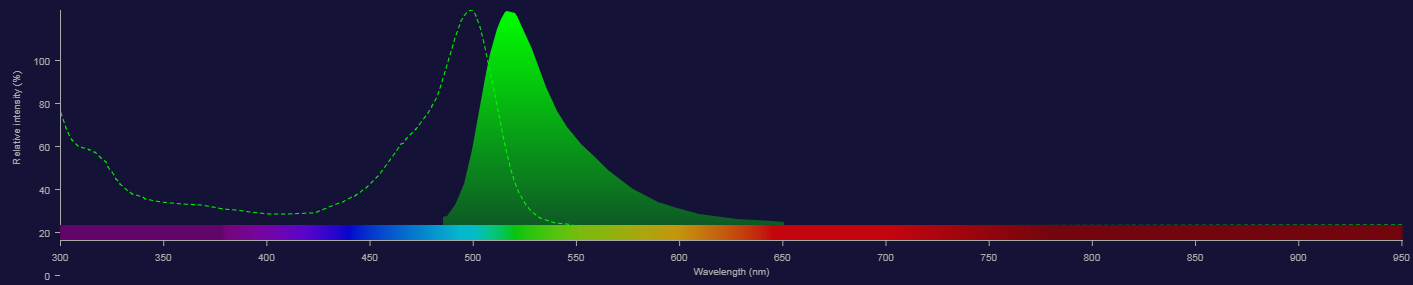
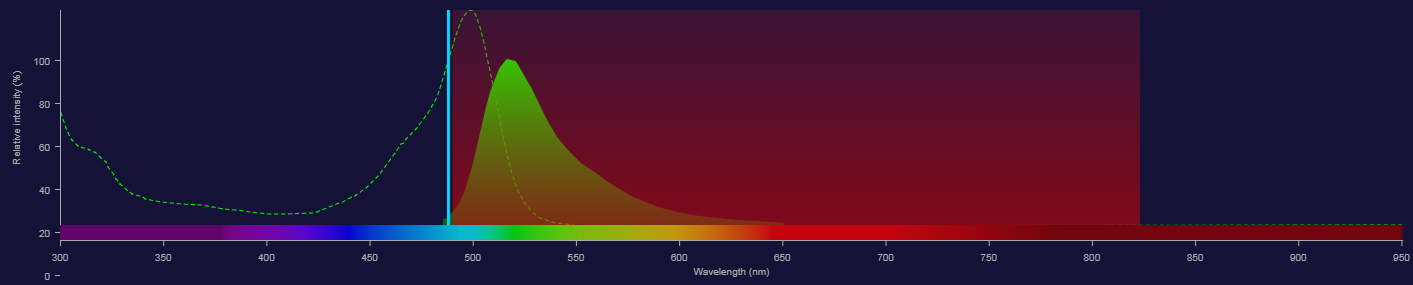
Fluorescence (capturing emission)
With one fluorochrome this is easy
- Collect all fluorescent light above the absorption spectrum knowing it is derived from our fluorophore
Fluorescence - Adding another fluorochrome
- How about PE?
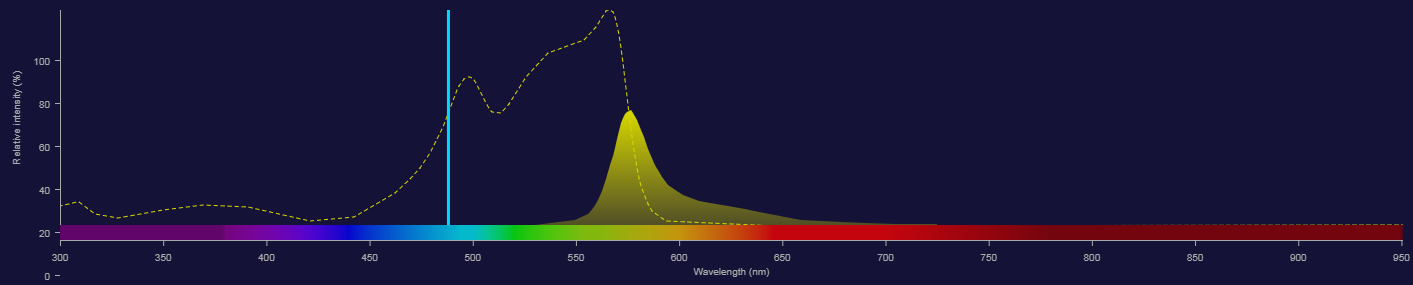
Fluorescence - Adding another fluorochrome
With 2 fluorophores we can't collect all of the fluorescence
- How would we tell which photons came from each fluorophore?
Fluorescence - Adding another fluorochrome
- We can filter the light with optical filters.
Fluorescence: Adding Another Fluorochrome
- Even if we are very selective with filters there will always be some light collected from the other/another fluorophore.

Fluorescence: Adding Another Fluorochrome
- Spectral overlap like this can be dealt with by controls and compensation
- Practical training will cover this
 )">
)">Types of Optical Filter
500SP (Short Pass)
500/50 BP (Band Pass)
500LP (Long Pass)
Stacking Filters

- All light collected from the event is directed to the detectors
- BP/LP stack extracts green light for measurement by PMT
- BP/LP stack extracts light blue light for PMT assessment
- Violet light is diverted for downstream assessment
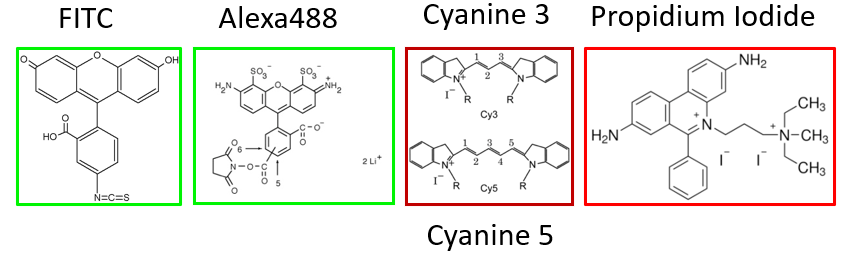
Fluorochromes for Antibody Labelling

Fluorochromes - Cyclic Ring Compounds
- FITC, Texas Red, Alexa 488, Propidium Iodide, Hoechst
- Generally small molecules
Fluorochromes - Tandem Dyes
- Tandem dyes were developed to expand the range of colours when cytometers were less sophisticated.
- Use DONOR and ACCEPTOR molecules

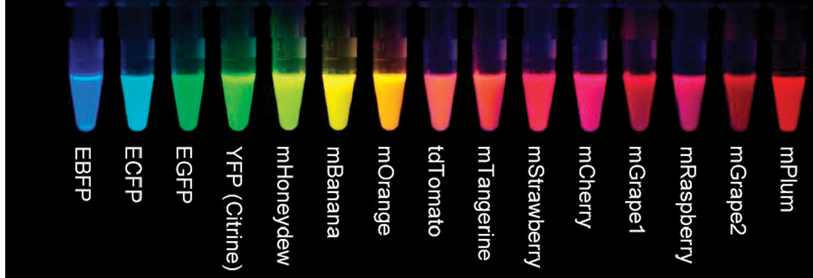
Fluorochromes - Fluorescent Proteins
Derived in the early 90's
- GFP
- RFP
- CFP
- BFP
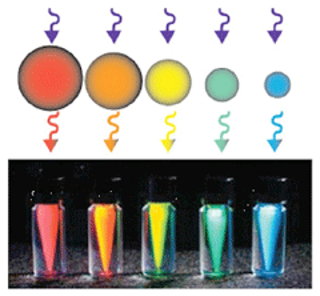
Fluorochromes - Nanocrystals
- Q Dots (Quantum Dots) – mid to late 1990s
- Size of crystal determines wavelength emitted
- Larger the crystal the redder the light
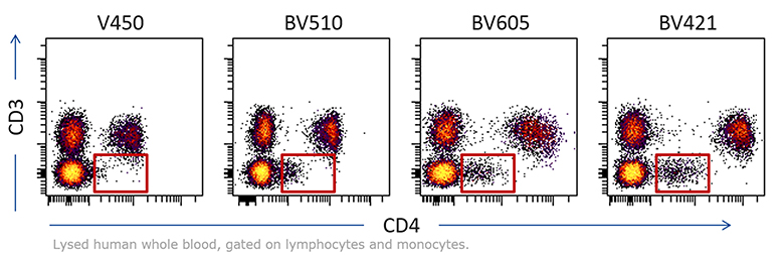
Fluorochromes - Polymer Dyes
- New class of dyes - early 2000s
- Use ‘molecular antennae’
- High Quantum efficiency
- Bright
- Brilliant Violet
- Brilliant Ultraviolet
- Brilliant Blue
- Brilliant YG
- Brilliant Violet
- Brilliant Ultraviolet
- Brilliant Blue
- Brilliant YG
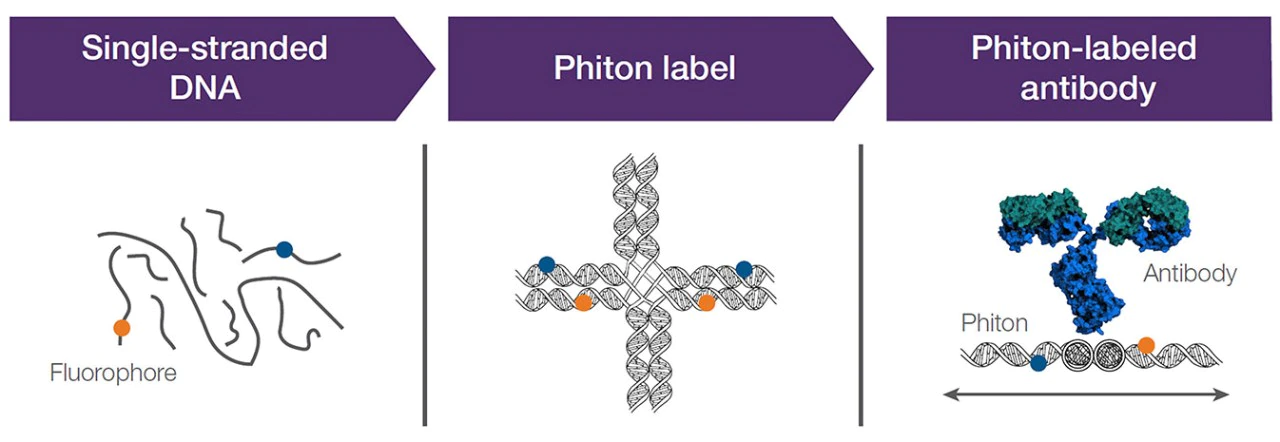
Fluorochromes - Nova Fluors - the other polymer dyes
- New spin on polymer dyes - ~2017
- Single stranded DNA backbone
- less cross-laser spillover
- 45+ panel fluorescence flow cytometry demonstrated
- DNA binding dyes interfere
- Fixable L/D only
- DNA binding dyes interfere
- Fixable L/D only
.webp)
Fluorochromes - Properties
So how do we assess fluorochrome brightness?
- Measure how far positive cells are from negatives (different fluorophores)
- Stain Index
- Separation Index
Stain Index = (MFIpos- MFIneg) / (2*SD)
Fluorochrome Brightness
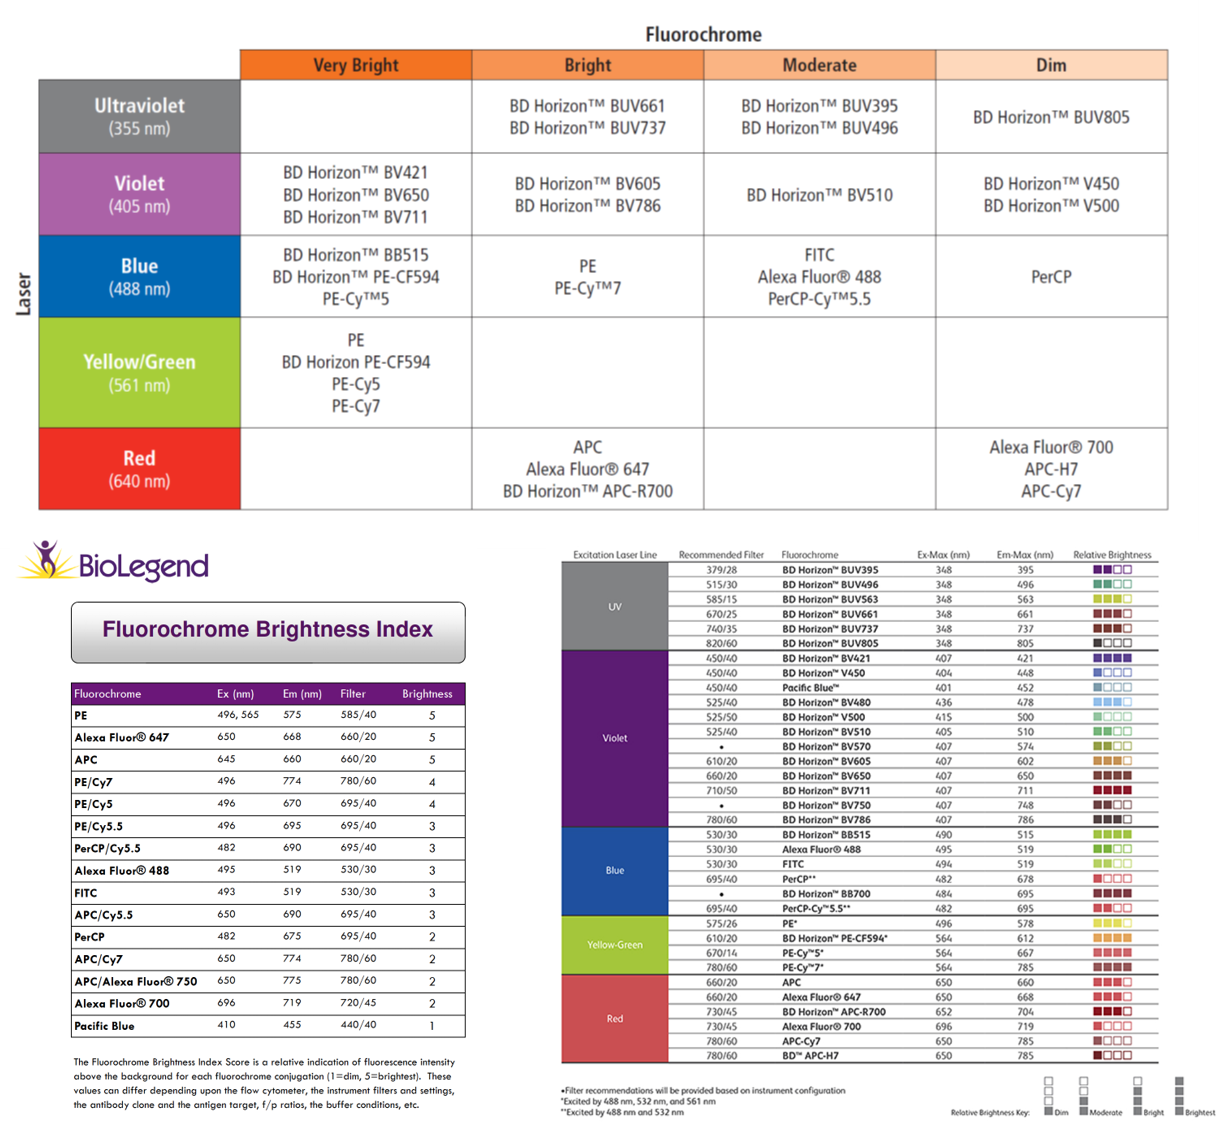
Fluorochrome brightness can be looked up on BD, Biolegend, Thermo etc sites if you don’t want to measure.
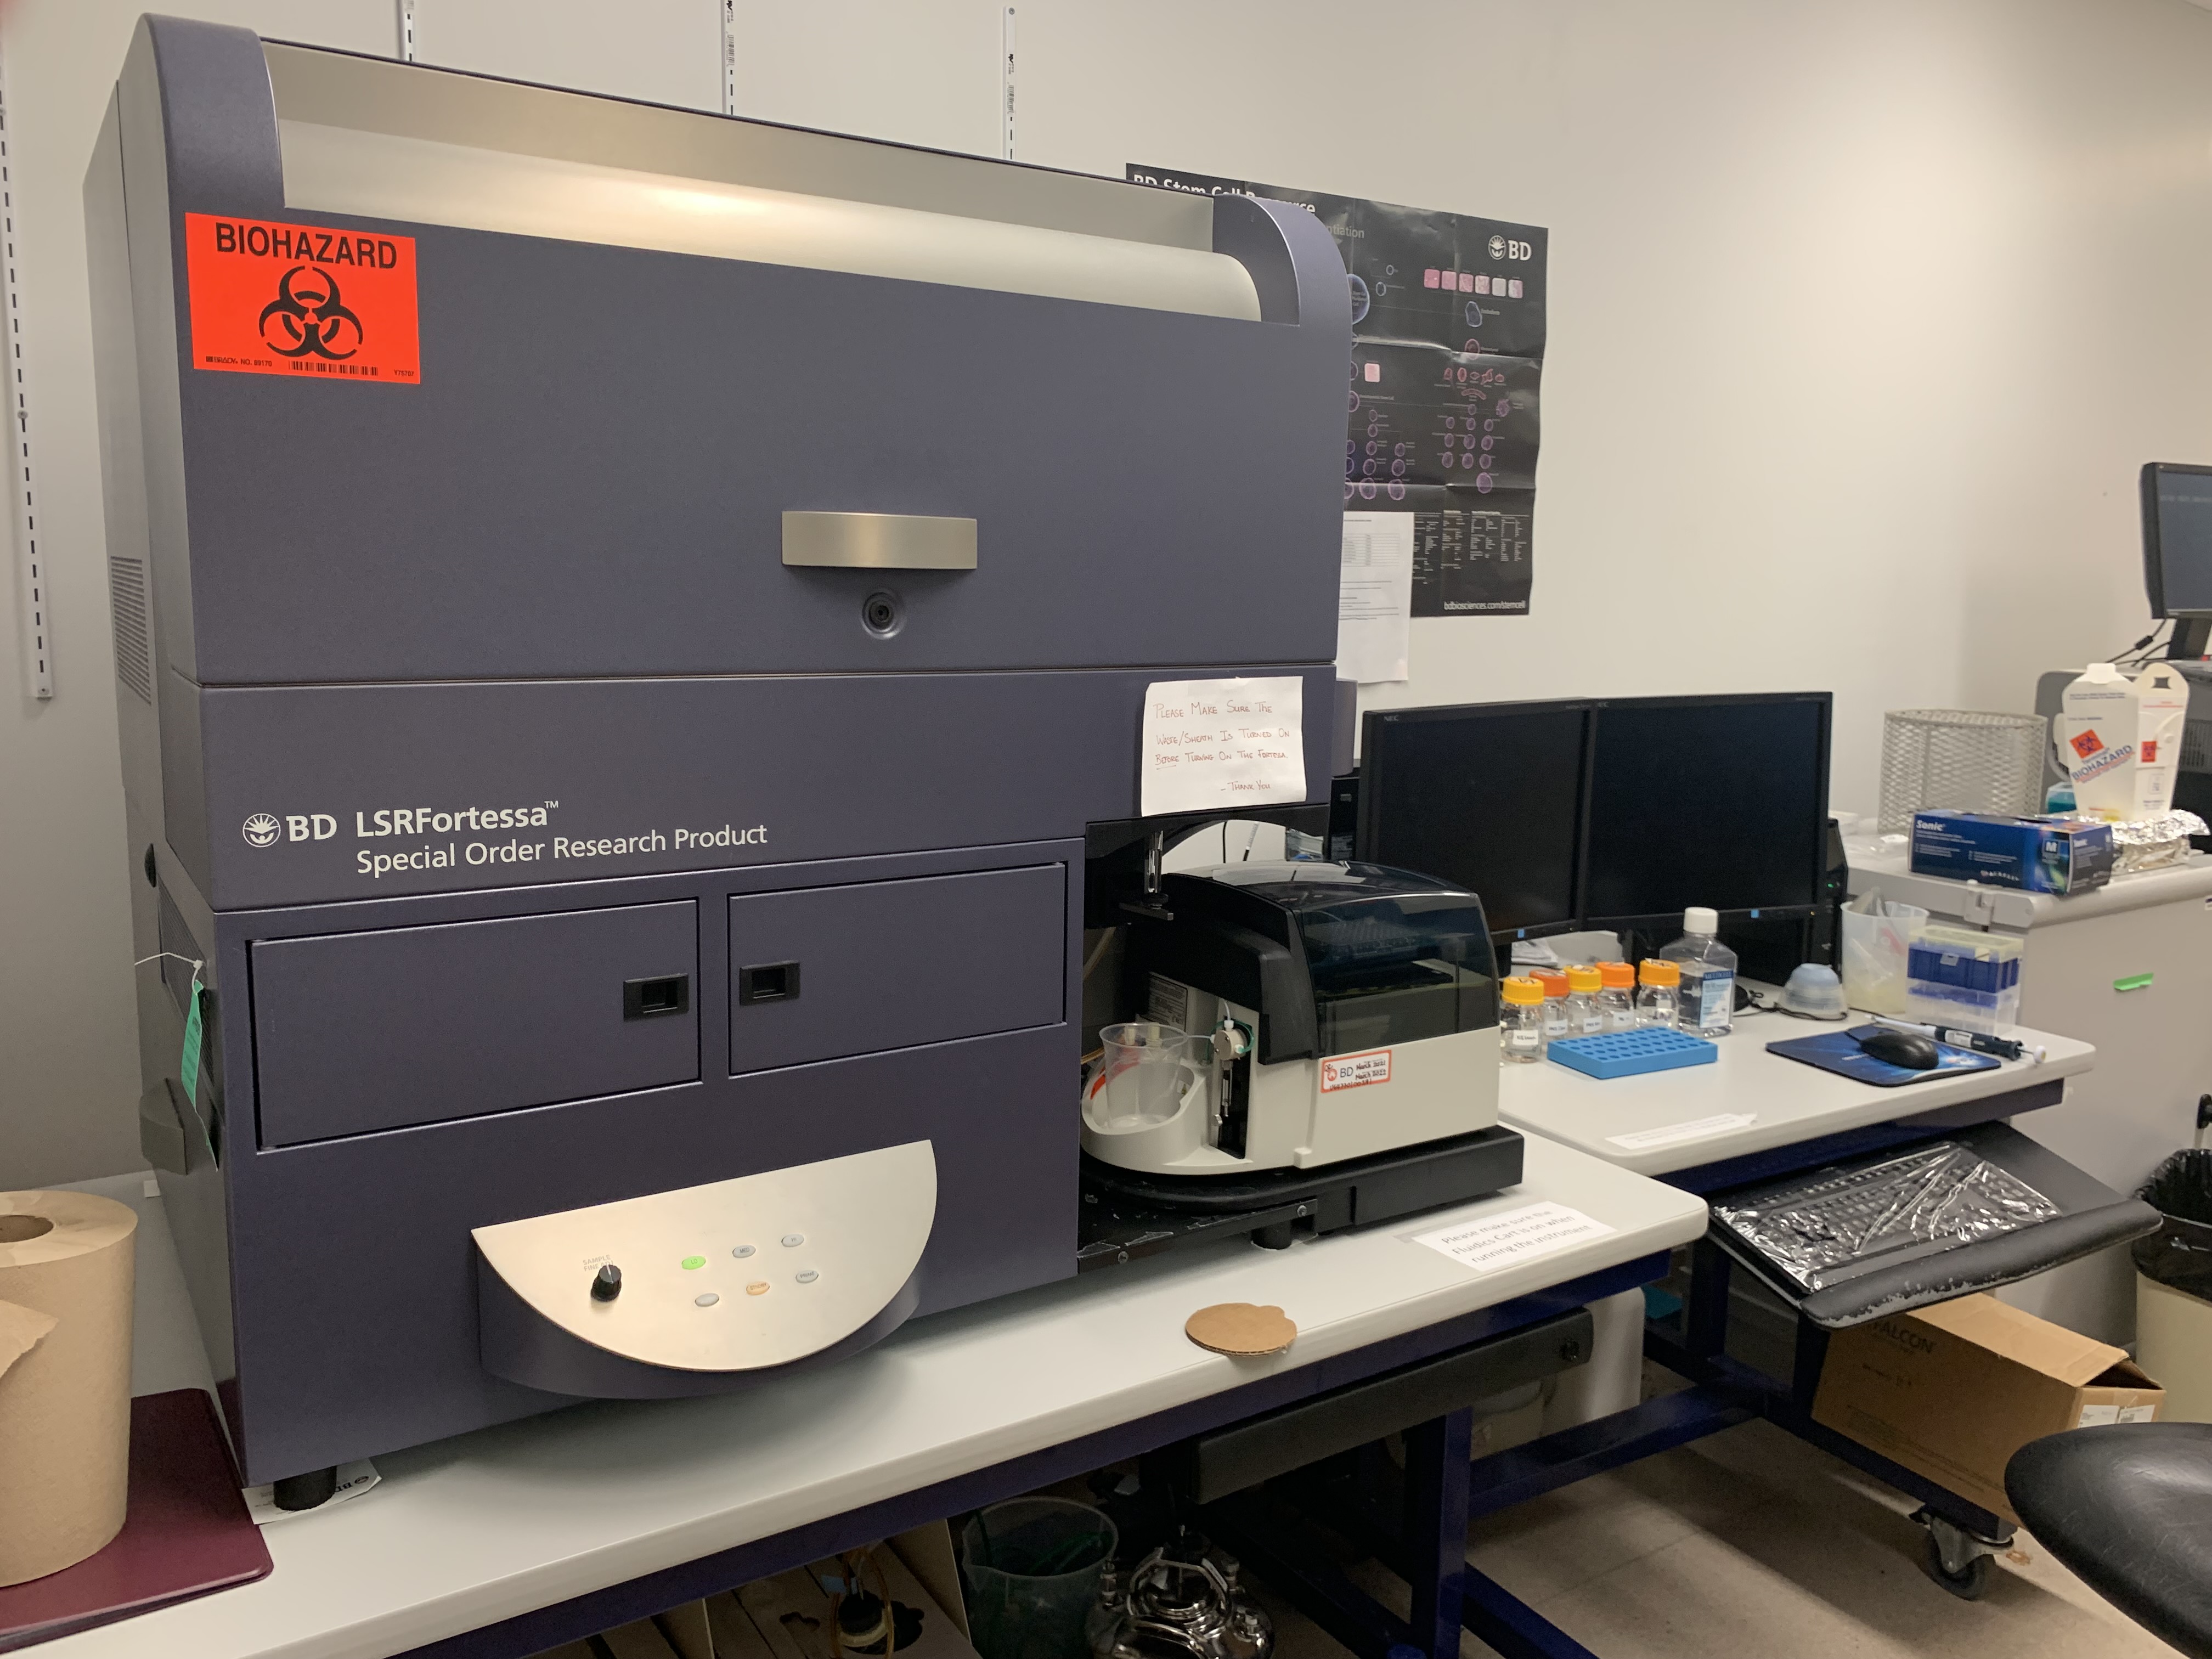
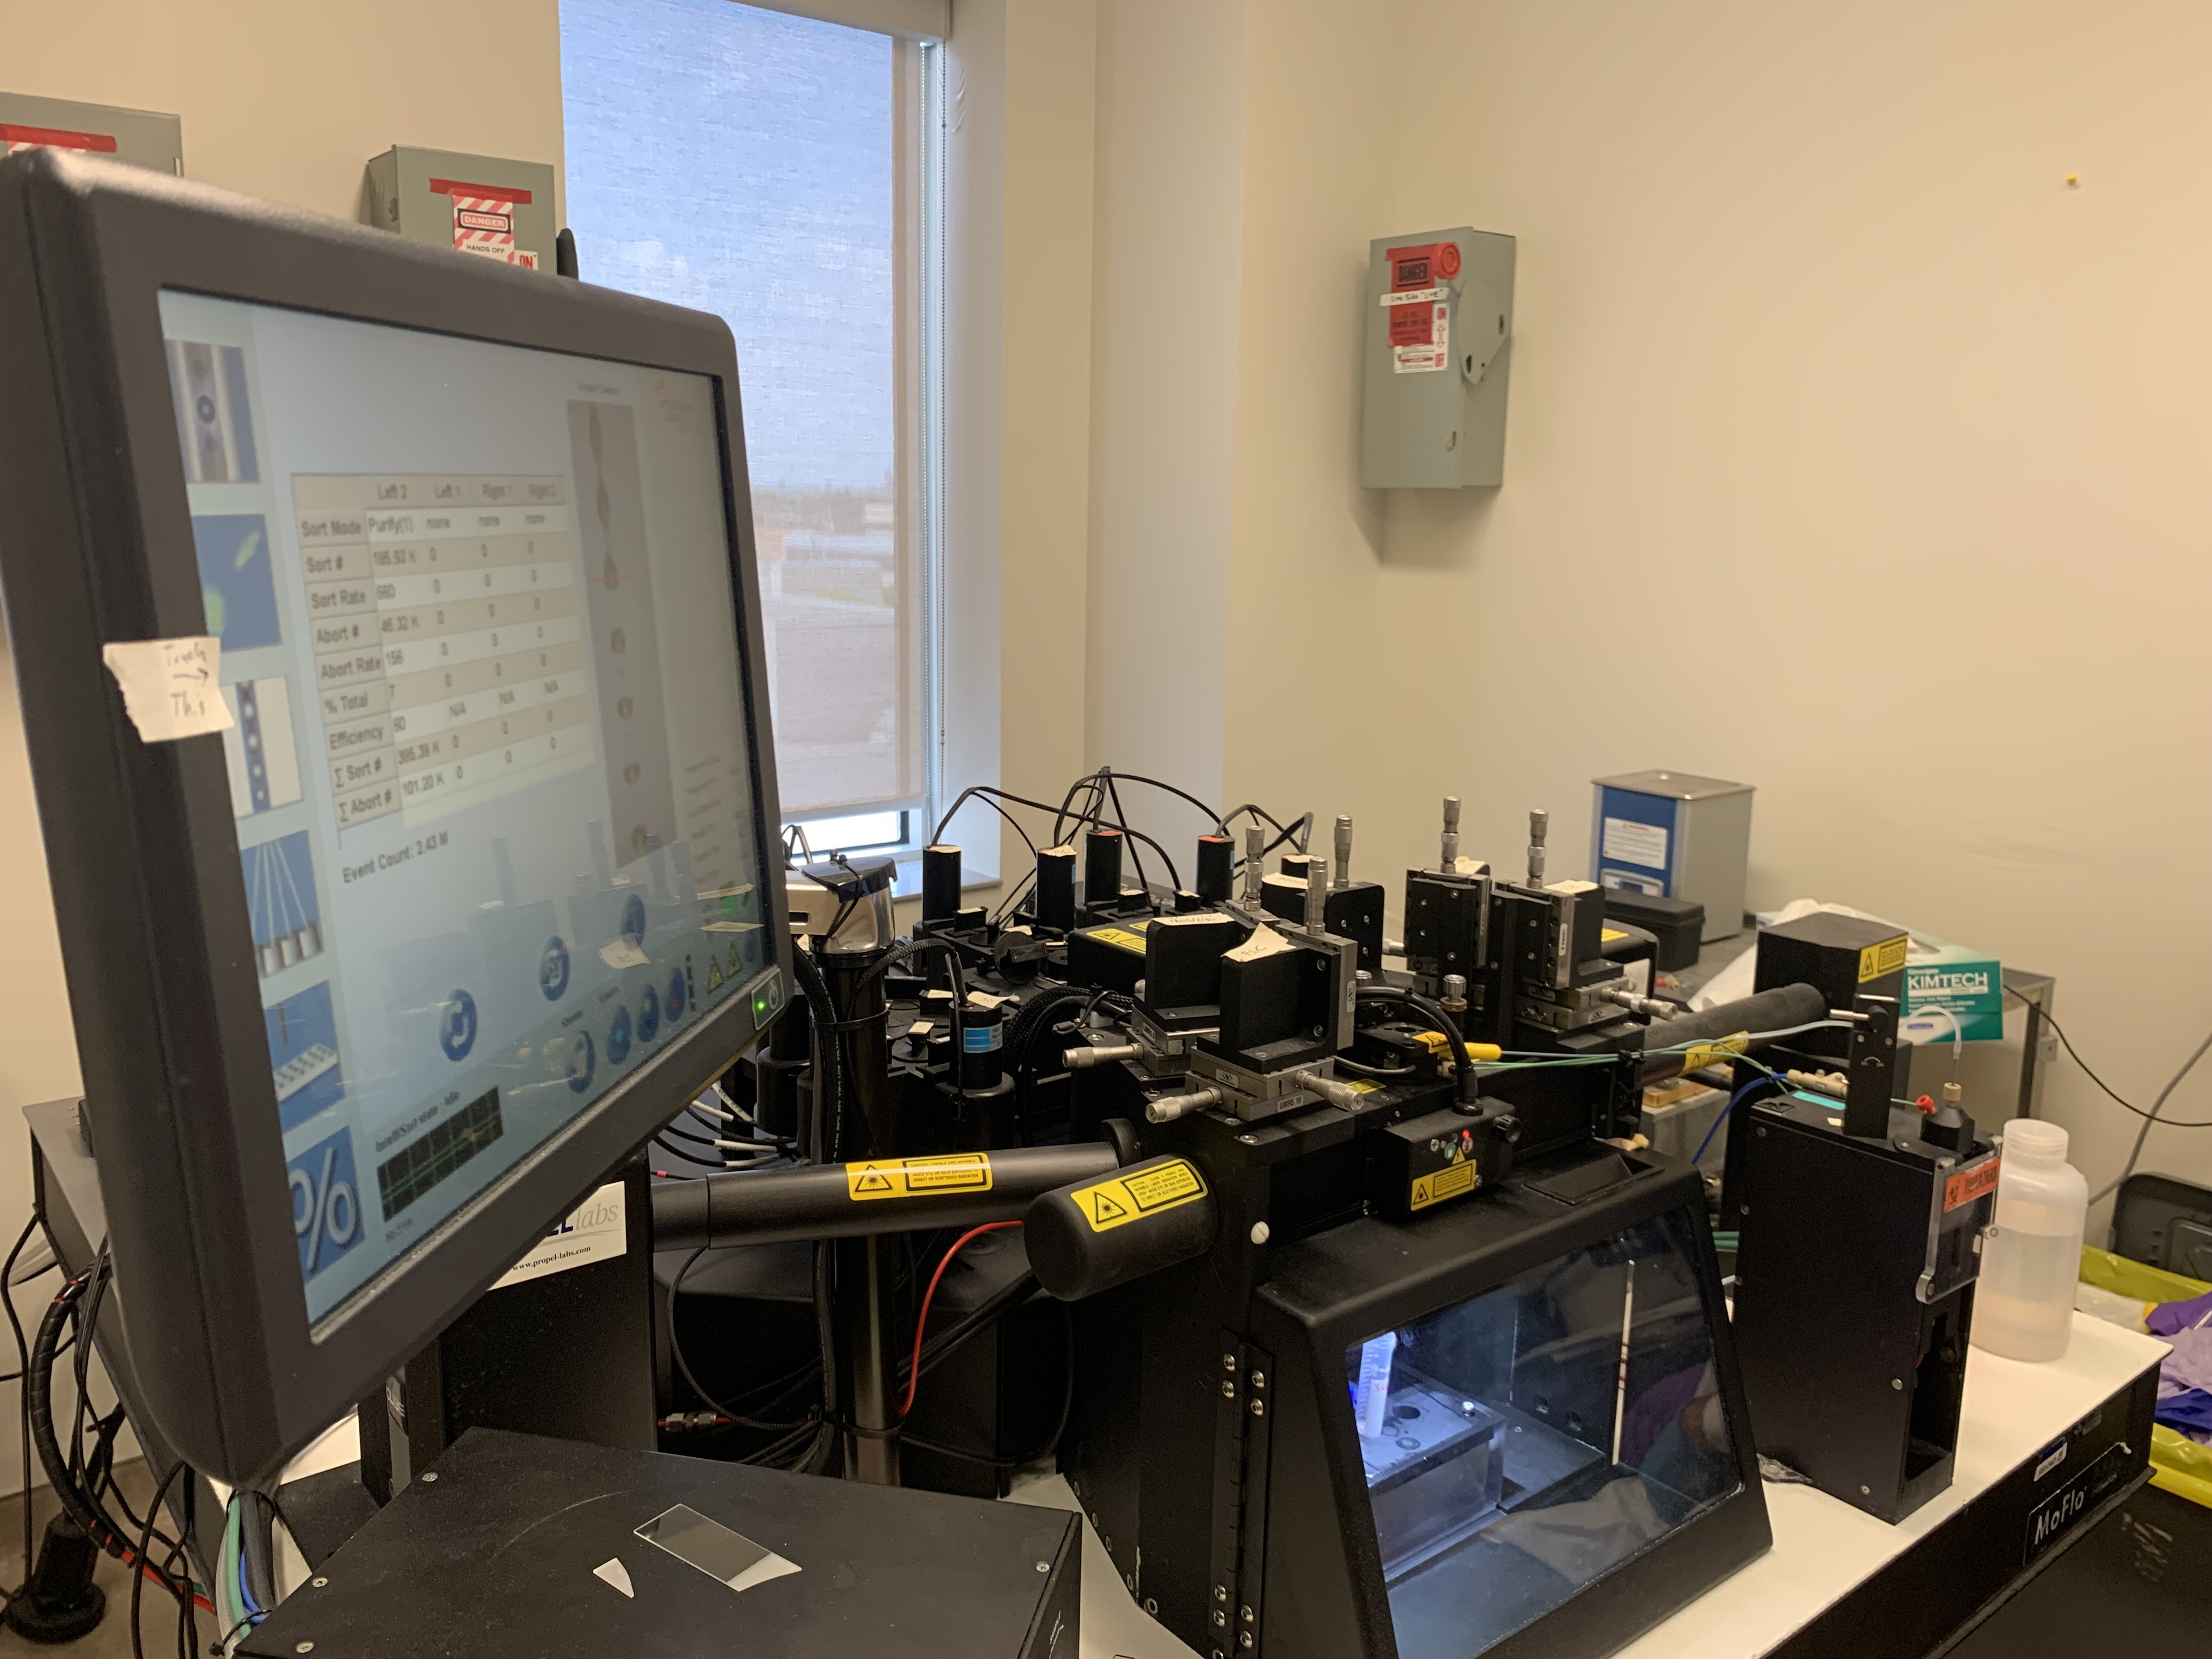
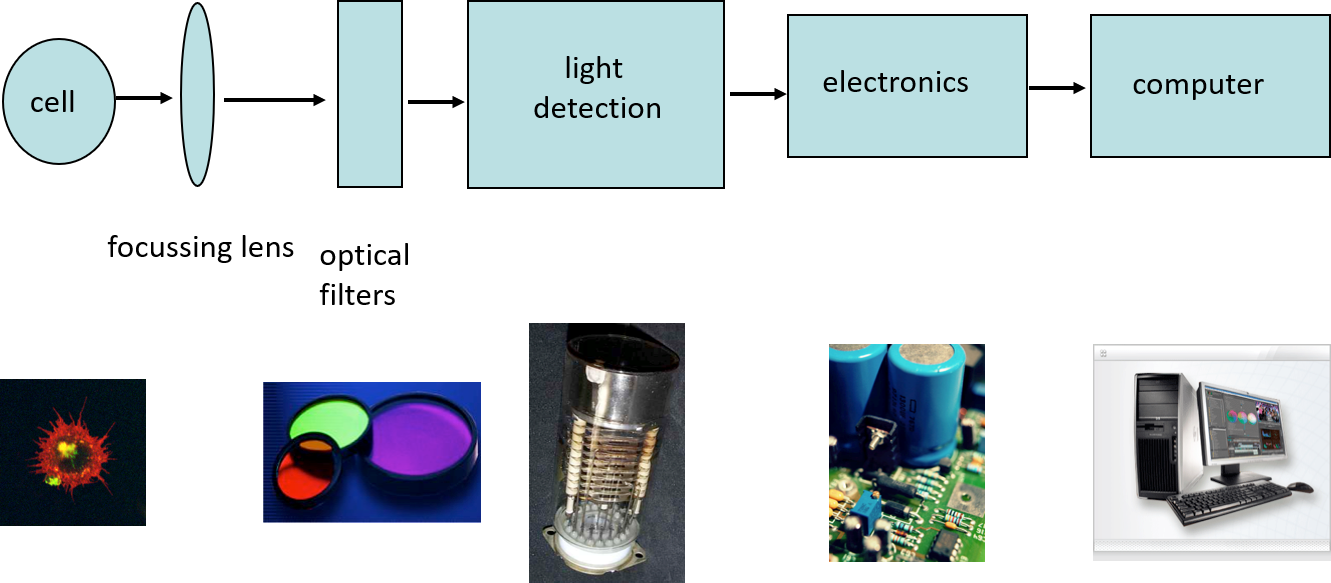
How does a cytometer work?
- Laser
- Fluidics
- Optics
- Filters
- Electronics
- Quantitation

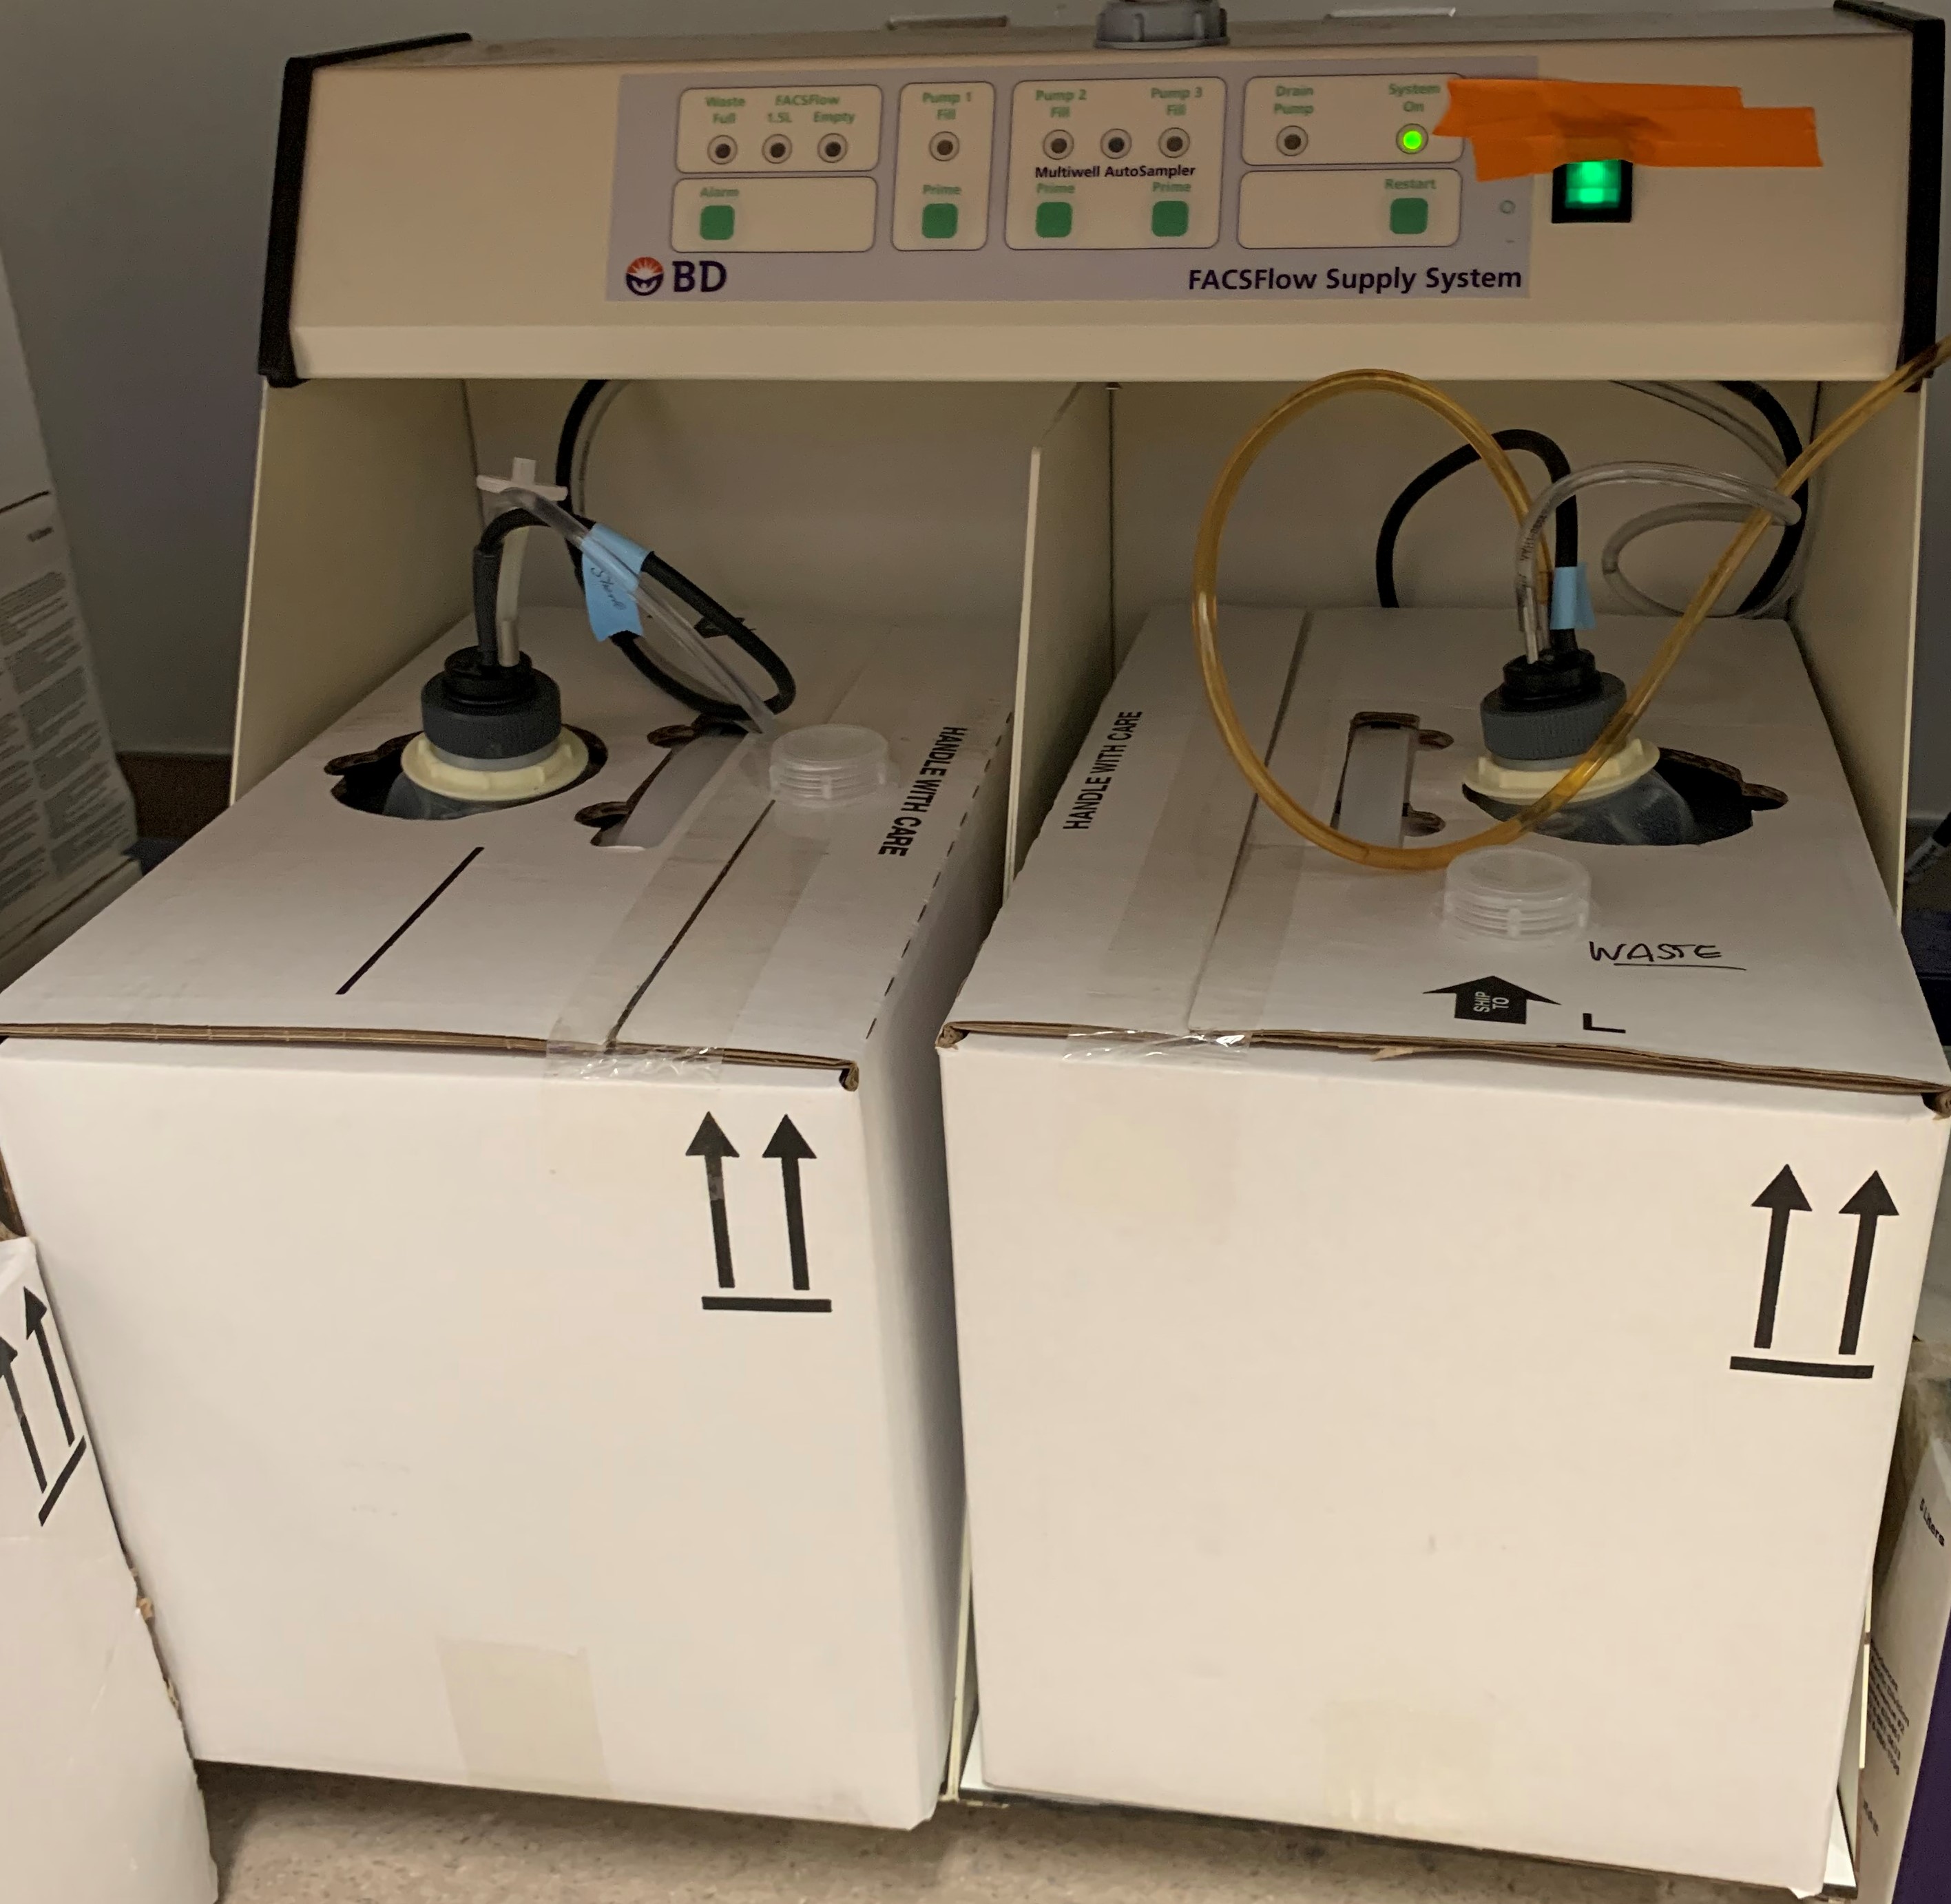
Cytometer - Sheath Fluid
- Sheath fluid (usually FACSFlow) is used to deliver the cells from a tube to the flow cell of the machine.
- It also aligns the cells to allow them to be individually analysed in the centre of the laser beam in the flow cell
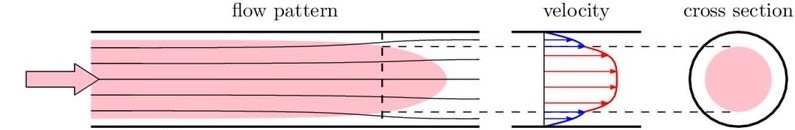
Cytometer - Laminar Flow
- Viscous drag at walls slows outer layers of liquid
- Particles are drawn toward centre of channel – hydrodynamic focusing
- The sheath fluid surrounds the sample in concentric layers.
- These layers do not mix.
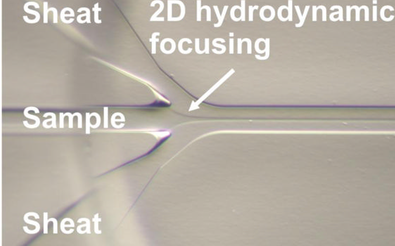
Cytometer - Hydrodynamic Focusing
- Aligns the cells so they go
- one by one
- through the centre of the laser beam (where the intensity is greatest)
- It pulls cells out like a ‘string of pearls’
- one by one
- through the centre of the laser beam (where the intensity is greatest)
What Happens when you press 'Hi'
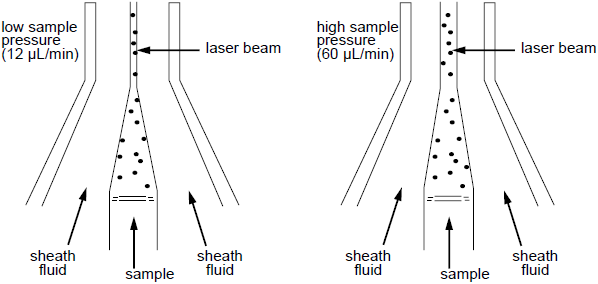
What Happens when you press 'Hi'
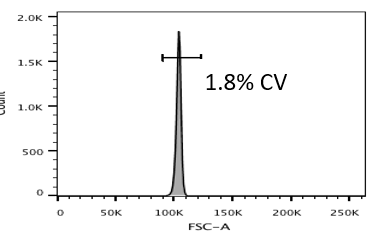
Low
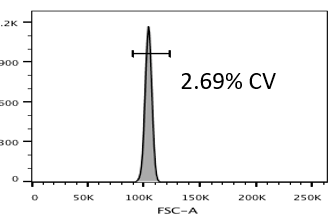
High
Cells enter the lasers Path
Cytometer - What do we detect?
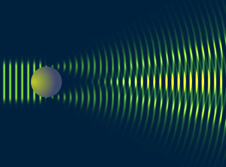
- Scattered laser light
- Fluorescent emission

Cytometer - what do we measure

Cytometer - what do we measure

Cytometer - Scattered Light
- Signal influenced by
- Cell size
- Refractive Index
- Nuclear : Cytoplasmic ratio
- Granularity
- Surface topography
- Correlates only
- Cell size
- Refractive Index
- Nuclear : Cytoplasmic ratio
- Granularity
- Surface topography
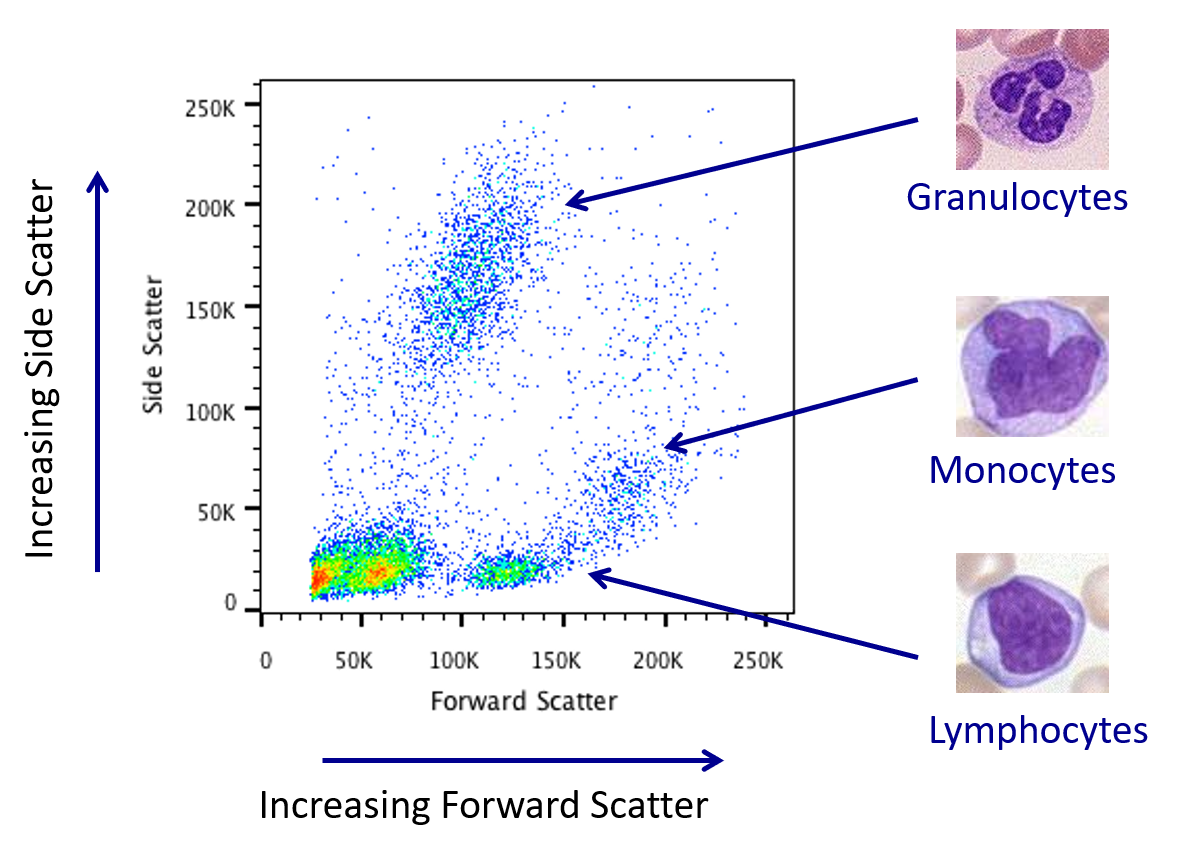
Cytometer - Scattered light
- What does whole blood look like?
- A heterogeneous population
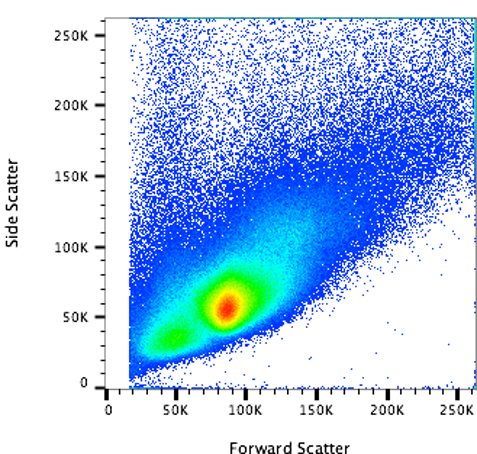
Cytometer - Scattered Light
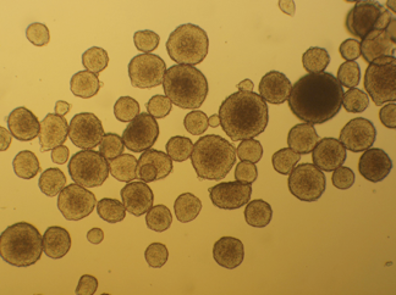
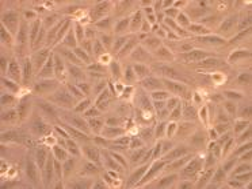
- What does a cell culture look like?
- More homogeneous
Cytometer - Fluorescence Emission Detection

- Fluorescence is emitted in all directions but is collected at 90°
- Optical elements (filters and dichroic mirrors) separate wavelengths and direct them to different pathways
Cytometer - Fluorescence detection
- Remember the spectral viewer
- How does that translate into how the instrument is set up?
- How does that translate into how the instrument is set up?
Cytometer - Fluorescence detection
- Red light collected first
- lowest energy
- lowest energy
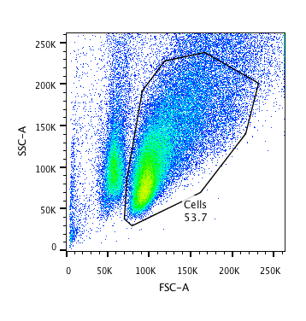
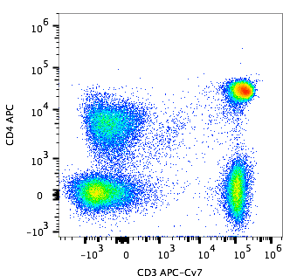
Cytometer - How histograms and dotplots are made
- listmode table of data
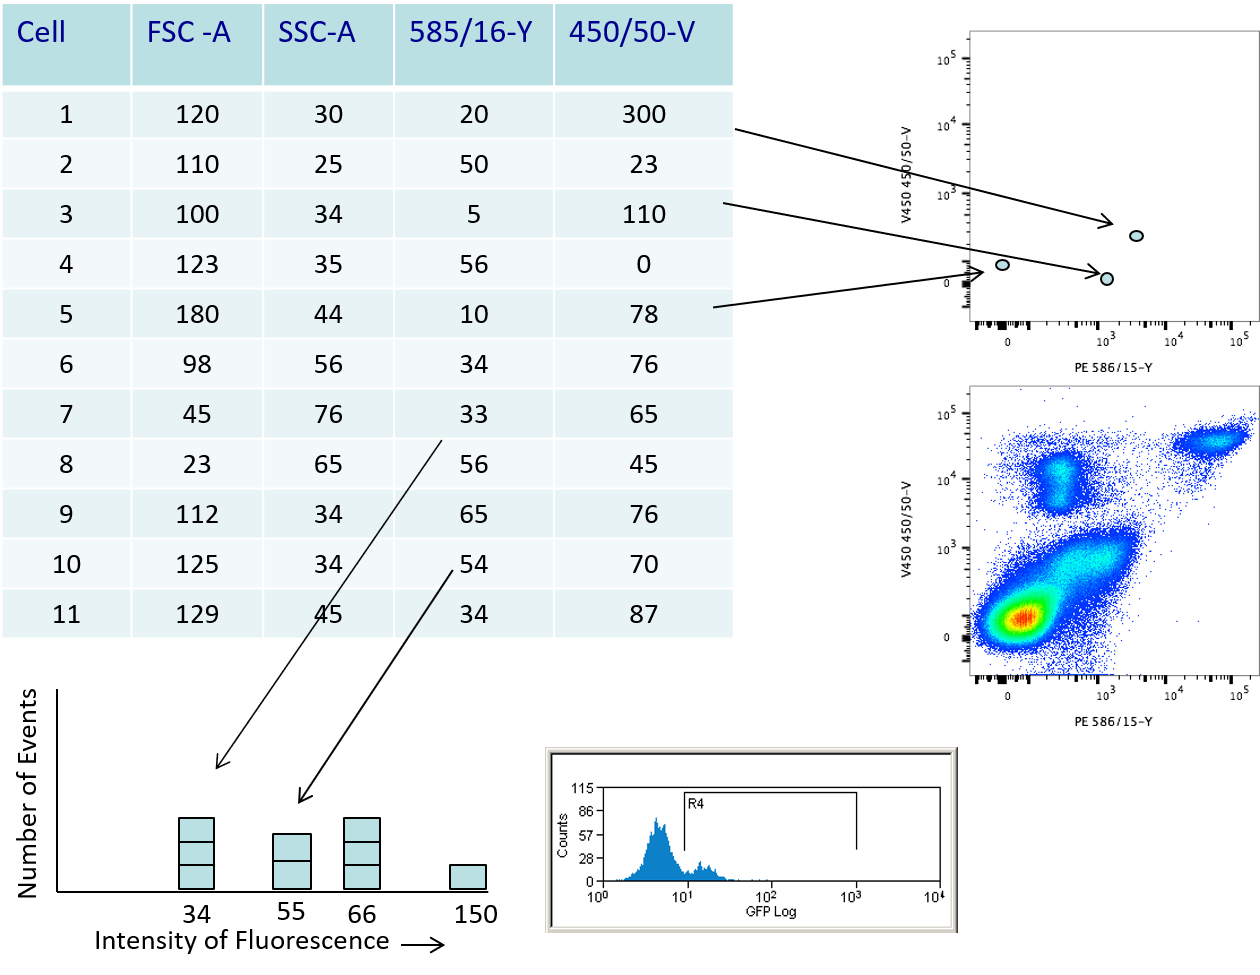
- Plotted for every cell
- Builds up density
- The histograms and dotplots we refer to are really density plots
Cytometer - Summary
Dissociating Cells
- Suspension cells e.g. Jurkat cells
- Cell lines, blood, bone marrow
- Can use Ficoll or similar gradient media
- If sticky, EDTA or DNAse in medium may help
- If using blood, consider lyse red cells
- Ammonium chloride or Commercial reagents
Dissociating Cells
- Adherent cells
- Cell lines
- Detachment using trypsin, collagenase, EDTA, Accutase
- Be aware of viability
- DNAse or EDTA in medium
- Differential centrifugation
Dissociating Cells
- Solid Tissue
- Biopsy, paraffin section
- Digestion or mechanical disaggregation
- Collagenase, trypsin, pronase
- May depend on antigen
- Cells v nuclei
Permeabilization
Where and Why?
- DNA
- Cytokines
- Intracellular proteins e.g. phospho-specific antibody
- Signaling pathways
- Cyclins
| Harsh | Gentle |
|---|---|
| Triton-X100 | Saponin |
| NP40 (IGEPAL) | Lysolecithin |
| Good for nuclear antigens | Good for cytoplasmic antigens |
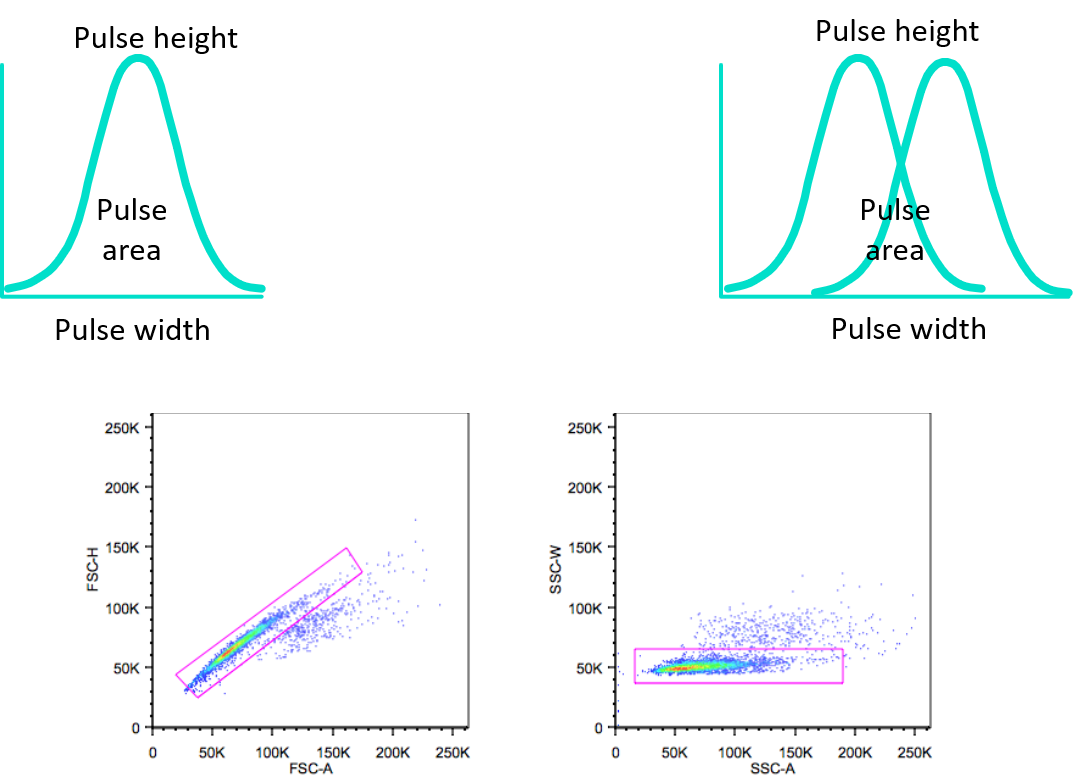
Doublet Discrimination
Data Analysis: The Normal Distribution
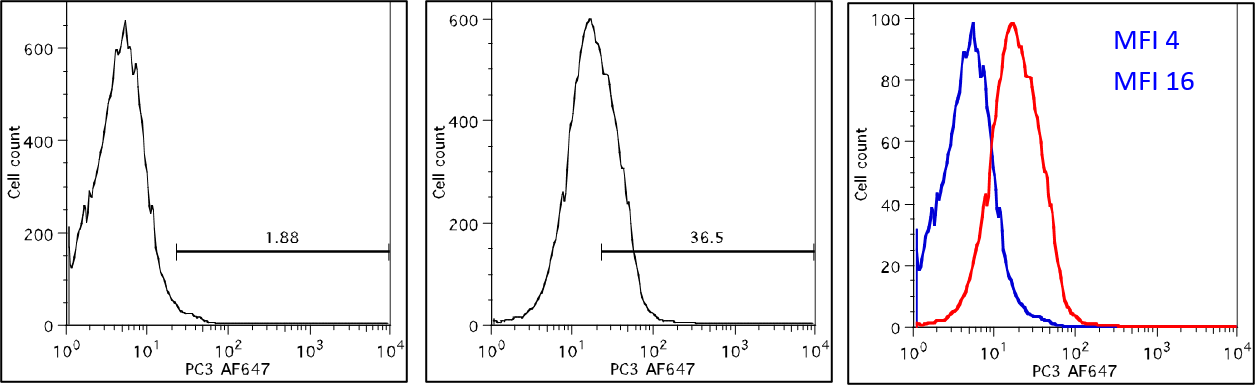
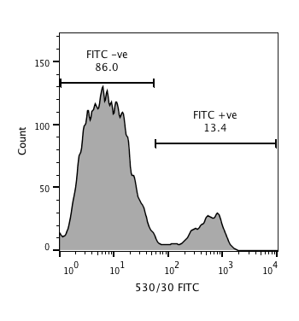
Data Analysis: Percentage Positive